Find Recurring Test Failures With Error Grouping
Recurring test failures are one of the most time-consuming problems in CI. Your pipeline goes red. The log says expect(received).toBe(expected) followed by a stack trace and nothing else. You dig through the output, find a timeout error, and fix the test. The next day, a different test fails with what looks like a different error — except it is the same timeout, hitting a different selector. You do not realize the two are related until a third test breaks the following week.
Meanwhile, someone deployed a change last Wednesday that introduced a new assertion failure. It started in 2 tests. By Friday it was in 5. Nobody noticed because each failure looked isolated — just another red build in a suite that occasionally goes red. There was no way to see the pattern, no way to ask “did this error exist before Wednesday?”
These are three distinct problems: failures without context, duplicate errors that look unrelated, and regressions that are invisible without trend data. SpecHive’s Error Explorer addresses all three by automatically grouping test errors, tracking them over time, and showing their impact across your test suite.
Why Recurring Test Failures Are Hard to Debug
Failures arrive without context. A CI log gives you a stack trace, an assertion message, and maybe a screenshot. It does not tell you whether this error has happened before, how many other tests are hitting the same issue, or whether it started after a specific deploy. Every investigation starts from zero. For a team running hundreds of tests across multiple branches, that adds up to hours of duplicated triage per week.
The same error appears in many tests but looks different each time. A backend timeout causes 15 test failures across 3 suites. Each failure has a slightly different message — different timestamps, different request IDs, different stack frame addresses. Without grouping, a developer triages them individually. The fix is one line of code, but discovering that it is one root cause takes longer than writing the fix.
Regressions hide in plain sight. A deploy introduces a new failure that affects 2 out of 50 tests. In any single CI run, it looks like noise. A week later it is in 8 tests. Without trend data, there is no signal that something changed — just a gradual increase in red builds that nobody correlates with a specific commit or deploy.
Automatic Error Grouping Across Test Runs
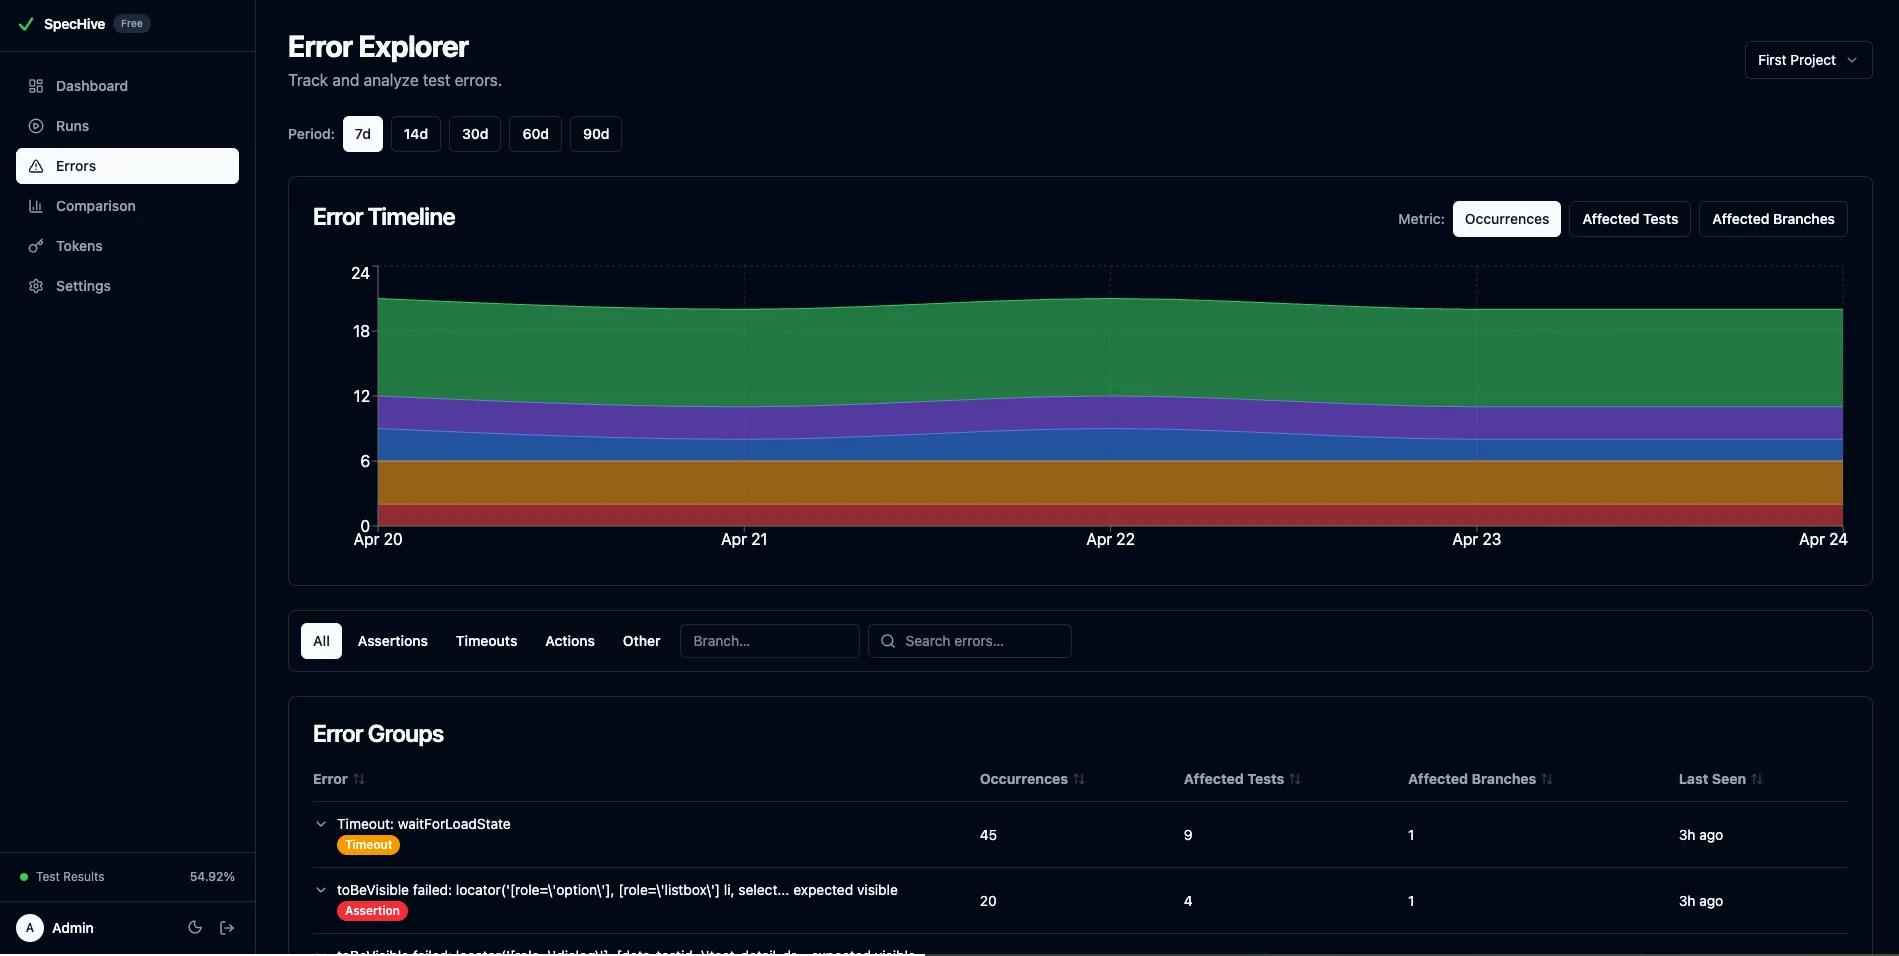
Error Explorer is a view in the SpecHive dashboard that groups test errors by structural fingerprint, tracks them over time, and shows which tests and branches are affected. It answers three questions: what errors are happening in your project, how are they trending, and what is their blast radius across your test suite.
If you are already sending test results to SpecHive, Error Explorer works immediately — no additional configuration required. Errors are extracted and grouped automatically from the results your reporter already sends.
How Error Fingerprinting Groups Related Failures
Two error messages that describe the same failure rarely look identical. Timestamps, UUIDs, memory addresses, and file positions change between runs. Naive string comparison treats them as different errors. Fingerprinting solves this by normalizing variable content before comparison.
Consider these two error messages from different runs of the same test:
Expected element a3f8c2e1-4d1e-4b9a-8c3f-1a2b3c4d5e6f to be visible
  at /tests/checkout.spec.ts:42:15
  Detached at 2026-04-02T14:23:07.891Z (frame 0x7ffee4c02a10)
Expected element 7d1e9b4a-5c2f-4a8e-9b1d-2e3f4a5b6c7d to be visible
at /tests/checkout.spec.ts:99:3
Detached at 2026-04-05T09:11:33.204Z (frame 0x7ffee4c0e820)The element IDs, timestamps, line numbers, and frame addresses differ, but the structural failure is identical. SpecHive normalizes both messages by replacing UUIDs, ISO timestamps, hex addresses, and file :line:column positions with placeholders, then hashes the first line of the result. Both messages produce the same fingerprint and land in the same error group.
For assertion-style errors reported by framework-aware reporters, fingerprinting goes further: it hashes the error category, matcher, target, and expected value as structured fields — and intentionally excludes the actual/received value, so runs that fail with different observed values still group together. This produces stable grouping even when the surrounding error message text changes between framework versions.
Errors are classified into three structured categories — assertion, timeout, and action — with a fourth other bucket that catches runtime exceptions and anything the reporter could not categorize. You can filter the error table by any of these to scope down to the type of failure you are investigating.
Track Test Failure Trends Over Time
The timeline chart (visible in the overview screenshot above) plots the top 5 error groups over a configurable period, defaulting to 30 days and extending up to 90. Each error group is drawn as a stacked area, and the metric is switchable between total occurrences, affected tests, and affected branches.
Detect Regressions After Deploys
This is where regressions become visible. You deploy on Tuesday. An error that did not exist before appears on Wednesday with 3 occurrences. By Friday it is at 12. The timeline makes that spike unmistakable — no manual log comparison required. You can correlate it with a specific deploy window and narrow down the cause before it spreads further.
Distinguish Frequency From Blast Radius
The switchable metrics add nuance. An error with 50 occurrences across 2 tests is a different problem than one with 10 occurrences across 8 tests. The first is likely a single flaky test looping through retries. The second is a systemic issue affecting a wide surface area. The timeline lets you distinguish the two at a glance.
See Which Tests and Branches Are Affected
Clicking into an error group opens a detail panel that lists the top 20 affected tests and top 10 affected branches, each with occurrence counts and the date last seen.
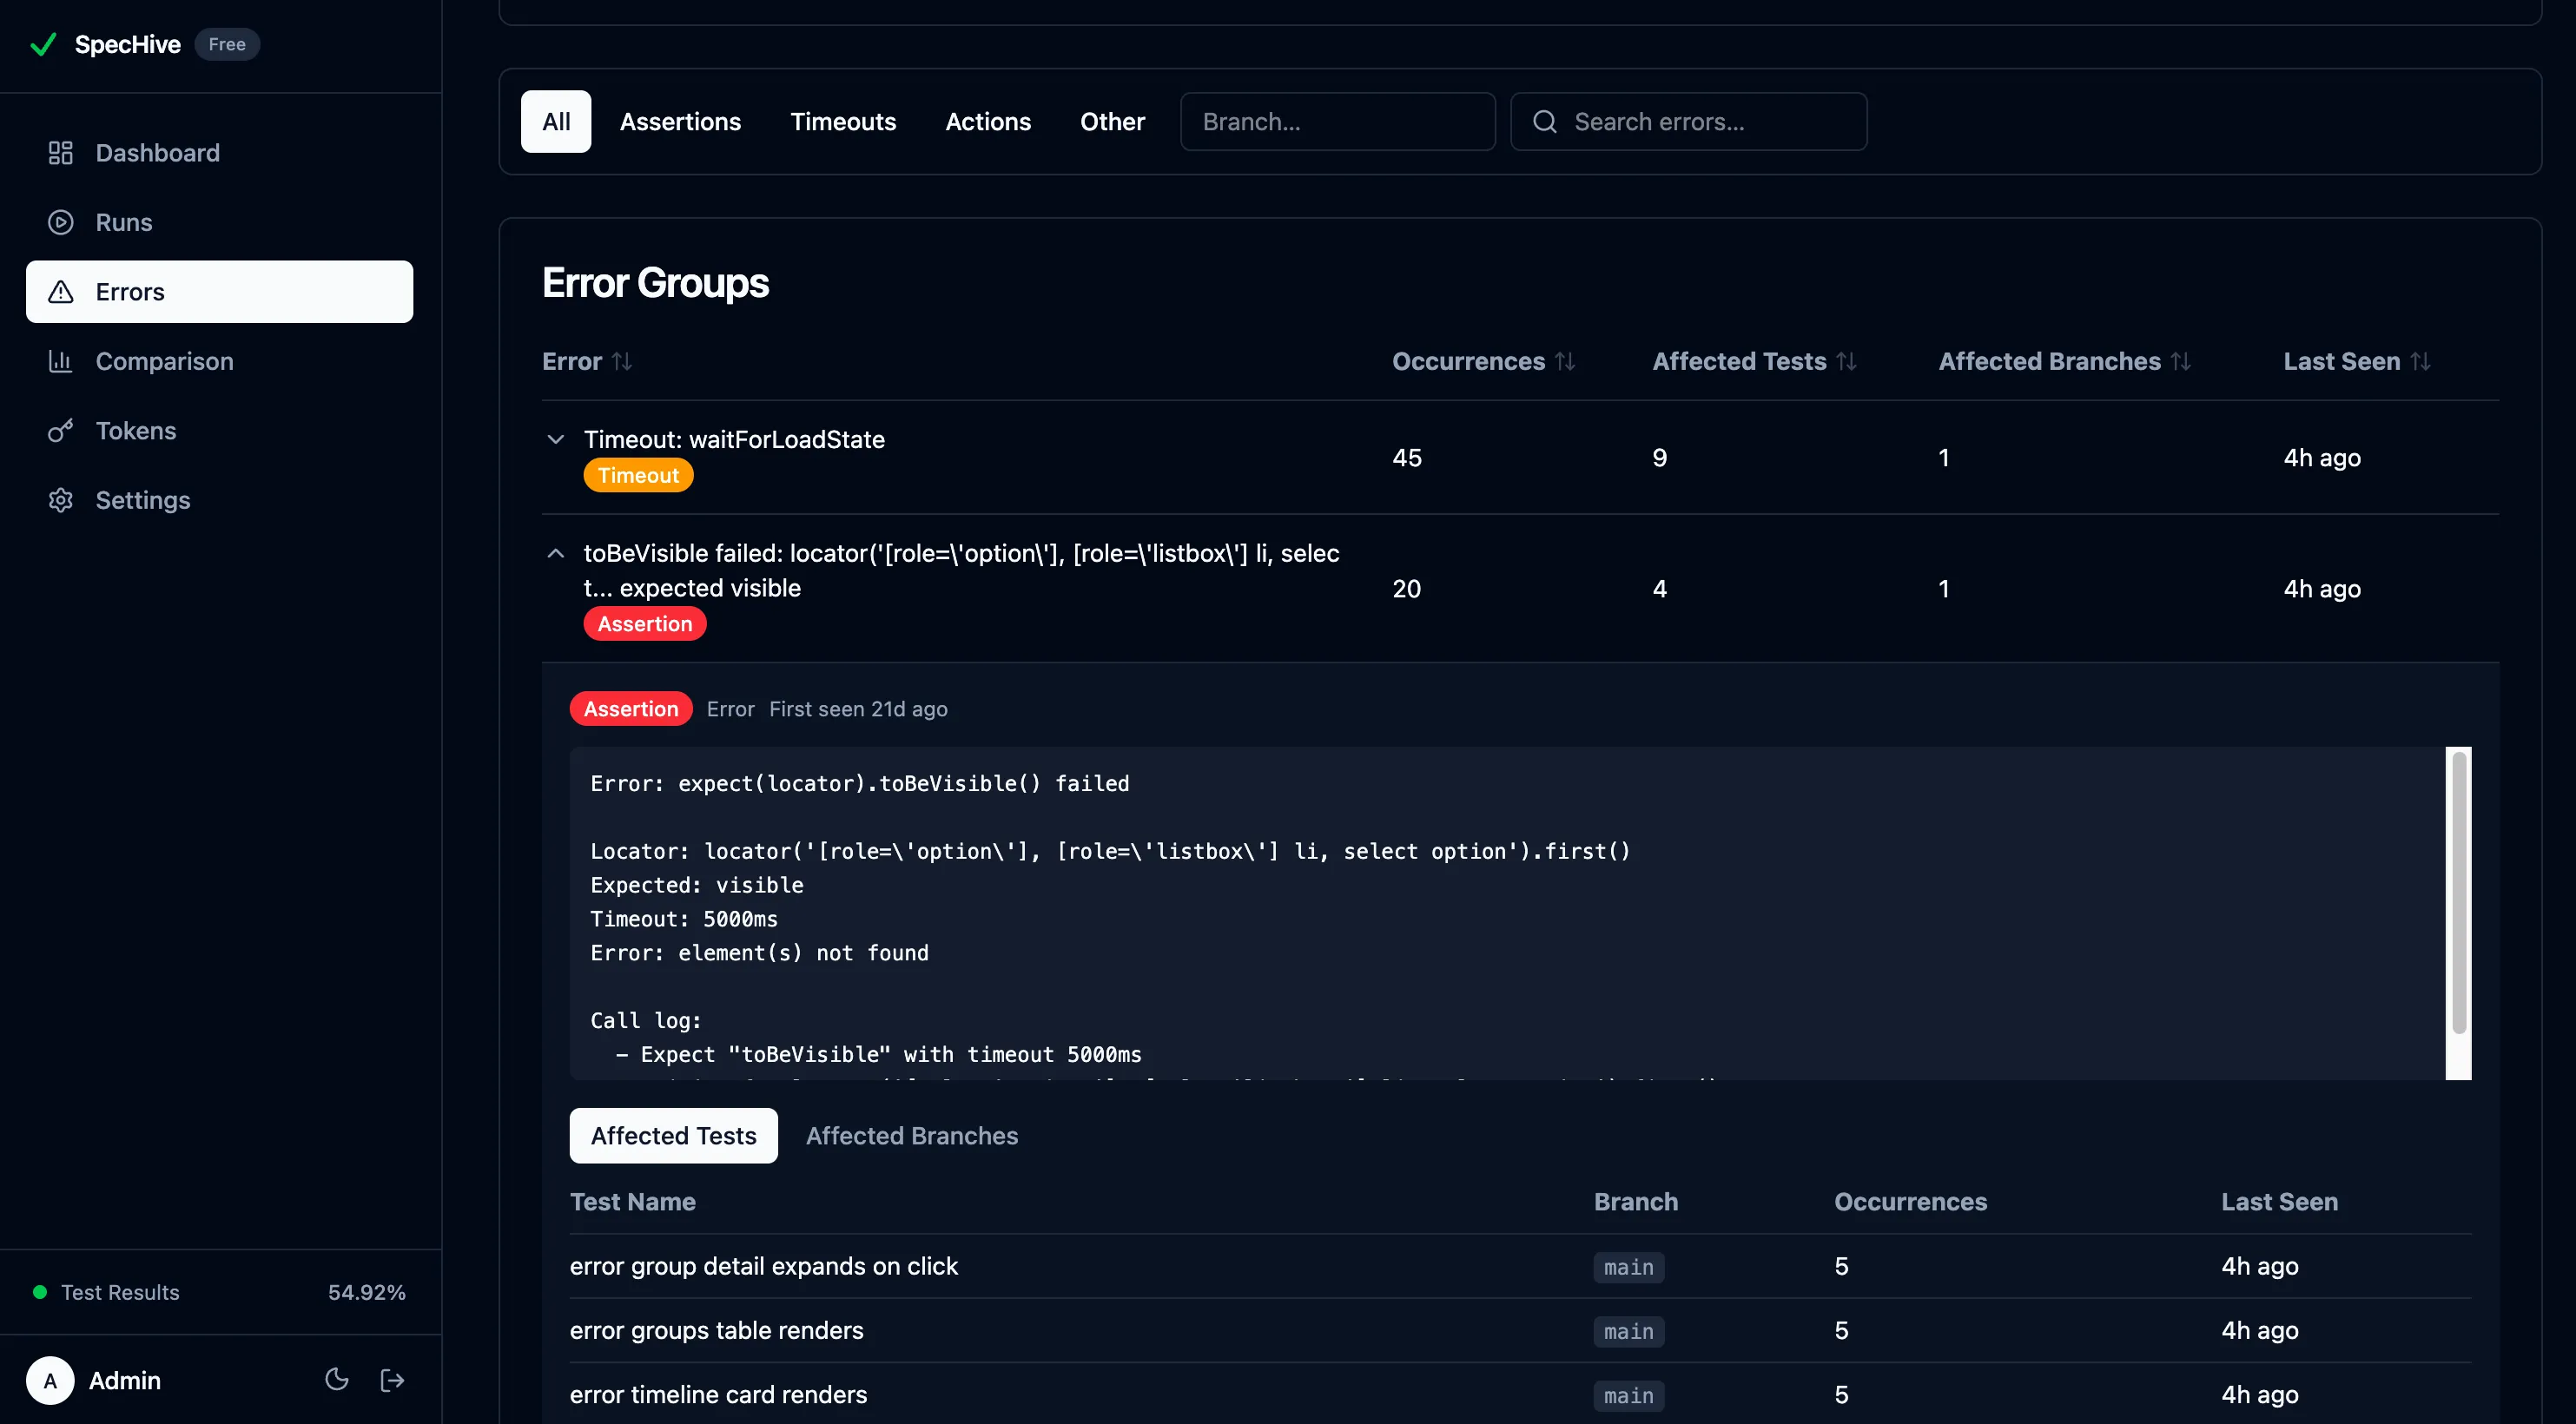
This directly addresses the “same error everywhere” problem. Instead of triaging 15 individual test failures, you see one error group with 15 affected tests — sorted by how often each test hits the error. You can see whether the error is isolated to a feature branch or present across main and multiple feature branches, which changes how urgently it needs to be fixed.
Errors in Context: Run and Test Detail Views
Error Explorer is not the only place errors surface. SpecHive embeds error information directly into the views you already use — run results and test details — so you get context without navigating away from what you are looking at.
Run Error Summary
When you open a run, a Top Errors card shows the 5 most common errors for that run. Each entry displays the error title, a category badge (assertion, timeout, action, runtime), and how many times it occurred. Every error links directly to its group in Error Explorer. A “View all errors” link at the bottom opens Error Explorer pre-filtered to that run’s branch — one click to go from “this run failed” to “here is everything failing on this branch.”
Test Detail Drawer
Clicking a failed test opens a detail drawer with structured error information that replaces the wall-of-text experience of a raw CI log:
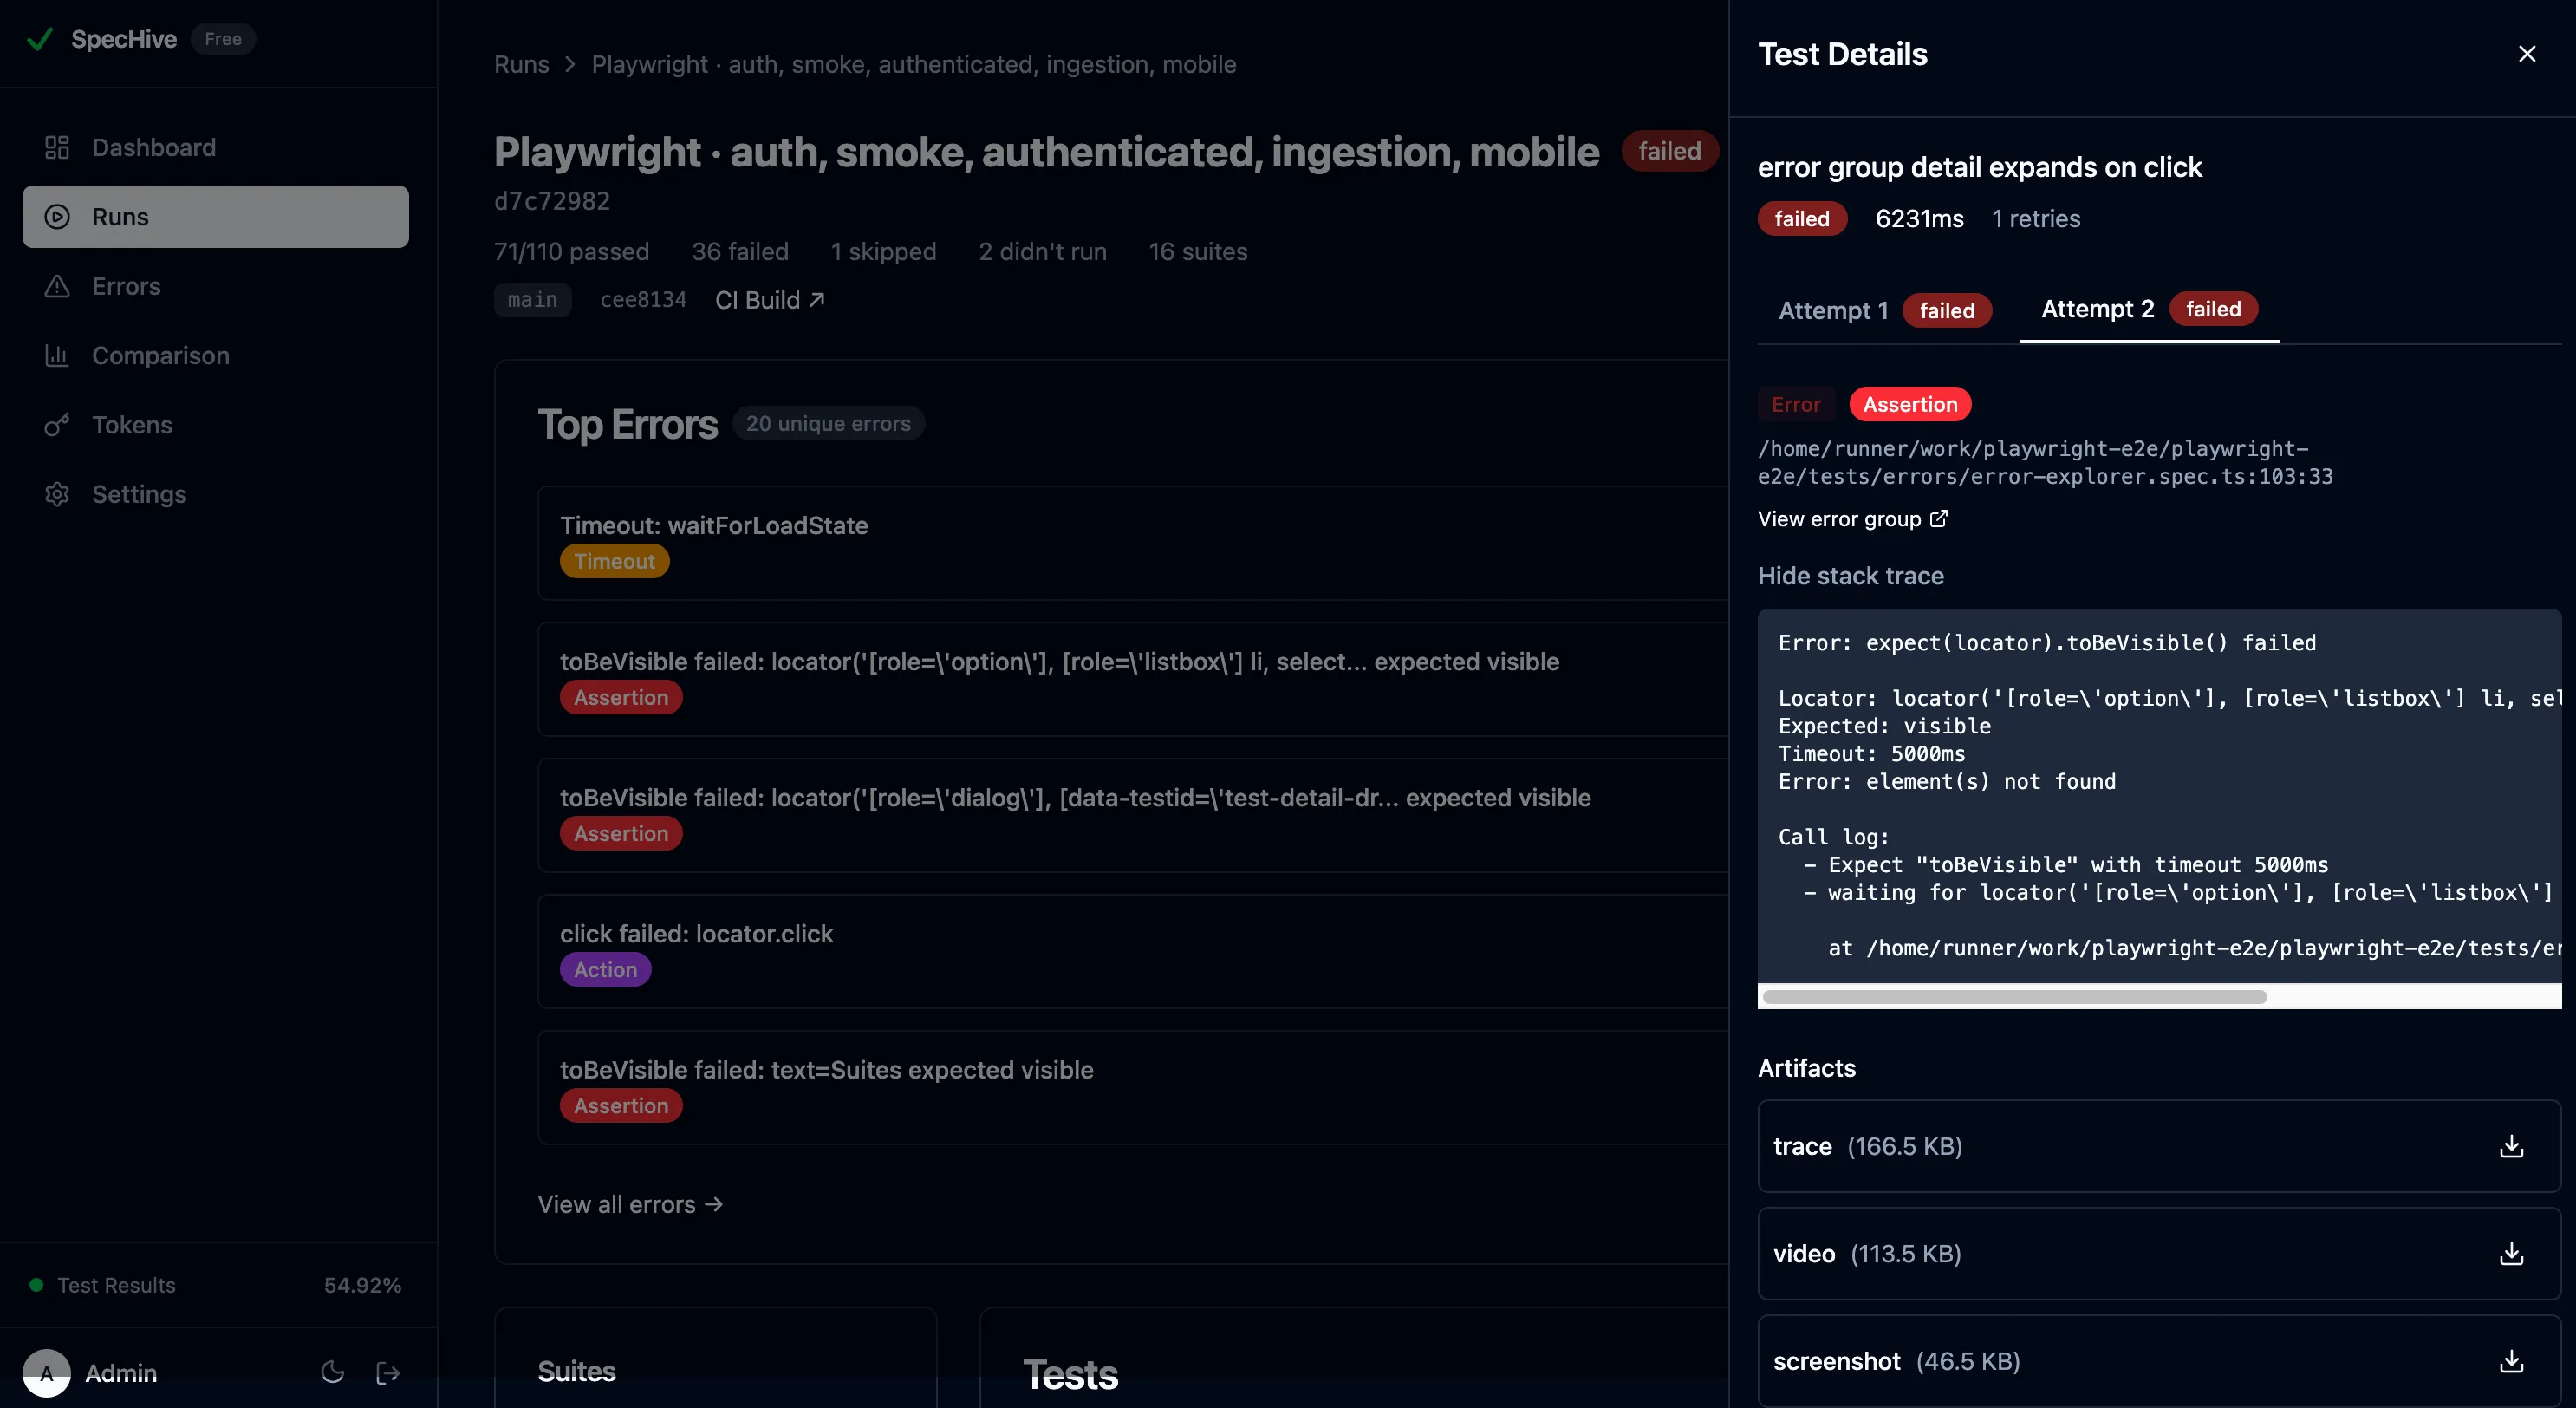
- Error name and category — displayed as badges at the top, so you immediately know whether you are dealing with an assertion failure, a timeout, or a runtime error.
- Expected vs. Actual — for assertion errors, the expected and actual values are shown side by side in color-coded boxes. No more parsing
Expected: X, Received: Yout of a stack trace. - Error location — the file name, line number, and column number where the error originated.
- Stack trace — collapsible, so it is available when you need it and out of the way when you do not.
- Retry attempts — for tests with multiple attempts, each attempt’s error is shown individually so you can see whether the failure was consistent or changed between retries.
At the bottom, a “View error group” link jumps to Error Explorer for the broader pattern — how many other tests hit this same error, which branches are affected, and whether it is trending up or down.
This creates a natural workflow: you see errors summarized on your run, drill into a test for full context, then jump to Error Explorer for the bigger picture. Every step adds more context without requiring any extra configuration.
Filter and Prioritize Test Errors
The error groups table supports filtering by category (assertion, timeout, action, runtime), by branch, and by free-text search across error messages. Columns are sortable by occurrences, unique tests, affected branches, last seen, and title.
Sorting by “last seen” surfaces newly appeared errors quickly — useful for catching regressions early. Sorting by “unique tests” highlights errors with the widest blast radius. Sorting by “occurrences” shows the most frequent failures overall. Combined with the branch filter, you can scope the view to a specific feature branch to see what errors are unique to that branch before merging.
Frequently Asked Questions
What is the difference between flaky and recurring test failures?
Flaky tests pass on retry within the same run — they fail non-deterministically. Recurring failures fail consistently across multiple runs and typically trace to one shared root cause. SpecHive’s Error Explorer groups recurring failures; the flaky test view handles non-determinism. Both can coexist on the same test, and together they give you the full picture of test suite health.
How does Error Explorer decide two failures are “the same” error?
Each error gets a structural fingerprint. When your reporter sends structured fields (errorCategory, errorMatcher, errorTarget, errorExpected), the fingerprint hashes those four values — intentionally excluding the actual/received value so runs with different observed data still group together. When only a raw error message is available, the fingerprint hashes the first line after normalizing UUIDs, timestamps, hex addresses, and :line:column positions to placeholders. Errors with different structural shape produce different fingerprints.
What happens if my reporter doesn’t send structured error fields?
You still get grouping — just via the fallback message-normalization path instead of the structured-field path. Group titles will be extracted from the first line of the normalized error, which tends to be slightly less readable than the structured equivalent but remains stable across runs. Upgrading the reporter to emit structured fields is drop-in when you’re ready.
Can I use Error Explorer on self-hosted deployments?
Yes, with no feature difference from cloud. Error grouping, the timeline chart, affected-test and affected-branch views, and the run and test detail integrations all work identically on self-hosted instances. Self-hosted has no test-result volume cap.
How do I action an error group once I’ve found one?
Each group links to every run and test it has appeared in. Open a recent occurrence, use the test detail drawer to inspect the assertion and stack trace, and pull the attached artifacts (screenshot, video, Playwright trace) to reproduce locally. The branch breakdown tells you whether the error is isolated to a feature branch or bleeding into main, which guides how urgently to fix it.
Getting Started
If you are already using SpecHive, open Error Explorer from the dashboard sidebar. Your error data is already there — grouped, trended, and ready to explore. No setup changes required.
If you are new to SpecHive, the free tier includes 5,000 test results per month on cloud, with no limits for self-hosted deployments. Get started free.
For initial setup, Setting Up Playwright Test Reporting in 5 Minutes covers the full reporter configuration. Error Explorer complements flaky test tracking — together they give you visibility into both intermittent instability and recurring failures across your test suite.
SpecHive is open source. View on GitHub.